![]() thehs2
thehs2
these web pages
are being produced by
Barry Cornelius

home
London to WestMids
Phase 1
maps
locations
KMLs
WestMids to Crewe
Phase 2a
maps
KMLs
official DfT data
Crewe to MCR
WestMids to Leeds
Phase 2b - 2016
maps
KMLs
official DfT data
Phase 2b - 2013
maps
KMLs
official DfT data
Other web pages
what is the HS2?
links
tweets
contact
privacy
The hill between Little Missenden and South Heath and the proposed HS2
The information on this web page was prepared in 2012. It has not been updated since then and so it may no longer be correct.
Below you can see a map from the Ordnance Survey. After a short while, a coloured line will appear superimposed onto it. This line shows the route of the proposed HS2 near to Little Missenden and South Heath. The line should be accurate as it is derived from data for the post consultation route that was published by the Department for Transport in January 2012.
This line is coloured red for cuttings, green for green tunnels and black for tunnels.
how to use the map below on your own web page
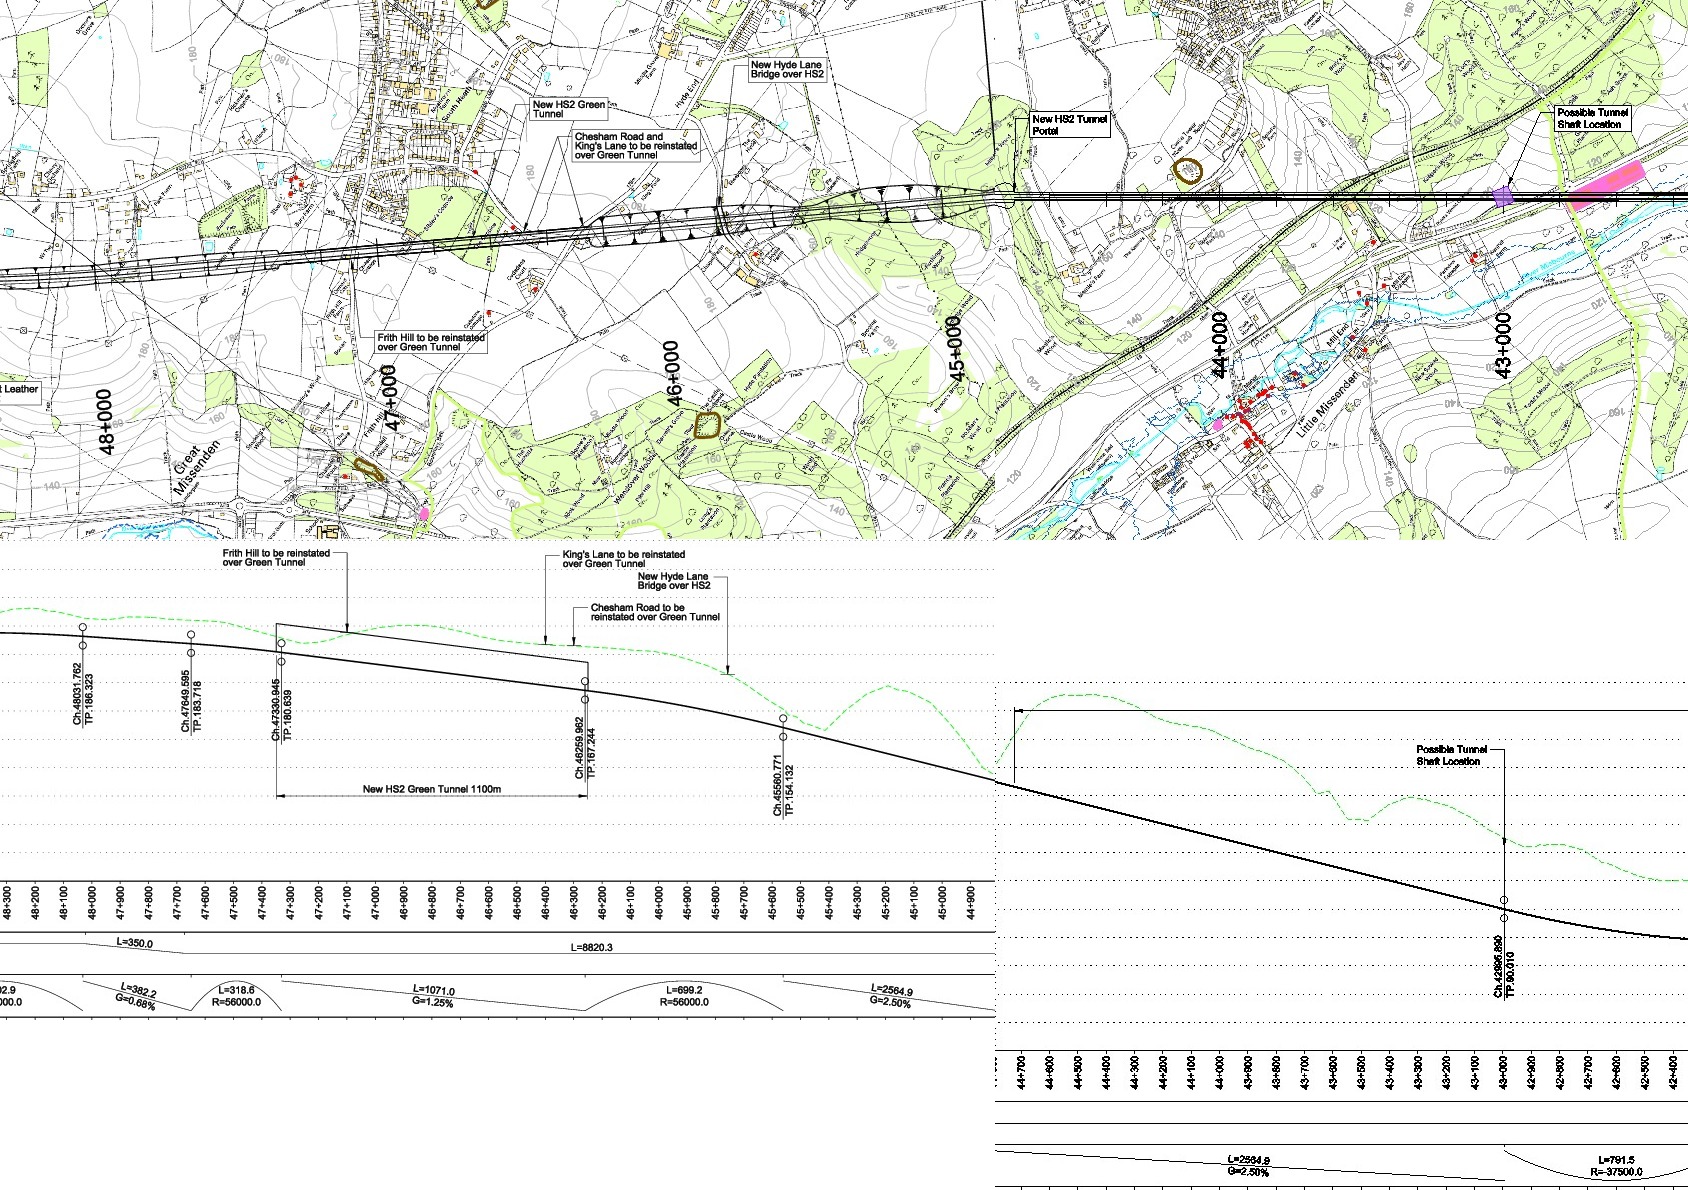
At this point the route climbs a hill. The route is about 80m in the south east (SP937984) when it goes under the River Misbourne in a tunnel. In the north west (SP897028) near to Springfield Farm, it at about 188m.
The steepest section of the hill is between SP933987 (when it is at about 90m) and SP916007 (when it is at about 155m). On the map given by the Department for Transport (see below), this steep section is marked as L=2564.9 G=2.5 which presumably means it has a gradient of 2.5% for 2.6K. Note: according to Wikipedia, the steepest sustained main-line railway incline in Great Britain is the Lickey Incline. This has a gradient of 2.65% for 3.2K.
The following map has been derived from maps that are in PDF files provided by the Department for Transport. It is actually a montage of extracts from two maps and they do not join well because the two maps have different alignments. Below the map, there is a graph showing the elevation of the route. If you click on the image and then click again, you can see a larger image.
Credits
The first map on this web page has been generated by www.thehs2.com. The underlying map is provided by OS OpenSpace and this is © Crown copyright and database rights 2012 Ordnance Survey. The generation of the map uses data provided by www.streetmap.co.uk. In order to superimpose an accurate line of the route of the proposed HS2, the map also uses data which was obtained from a shape file provided by the Department for Transport and released with an Open Government Licence.
A Department for Transport web site provides PDFs giving maps of the route. The second map on this web page is derived from two of those PDFs.